
Managing project finances with thesheet’s financial overview
What is the financial overview?
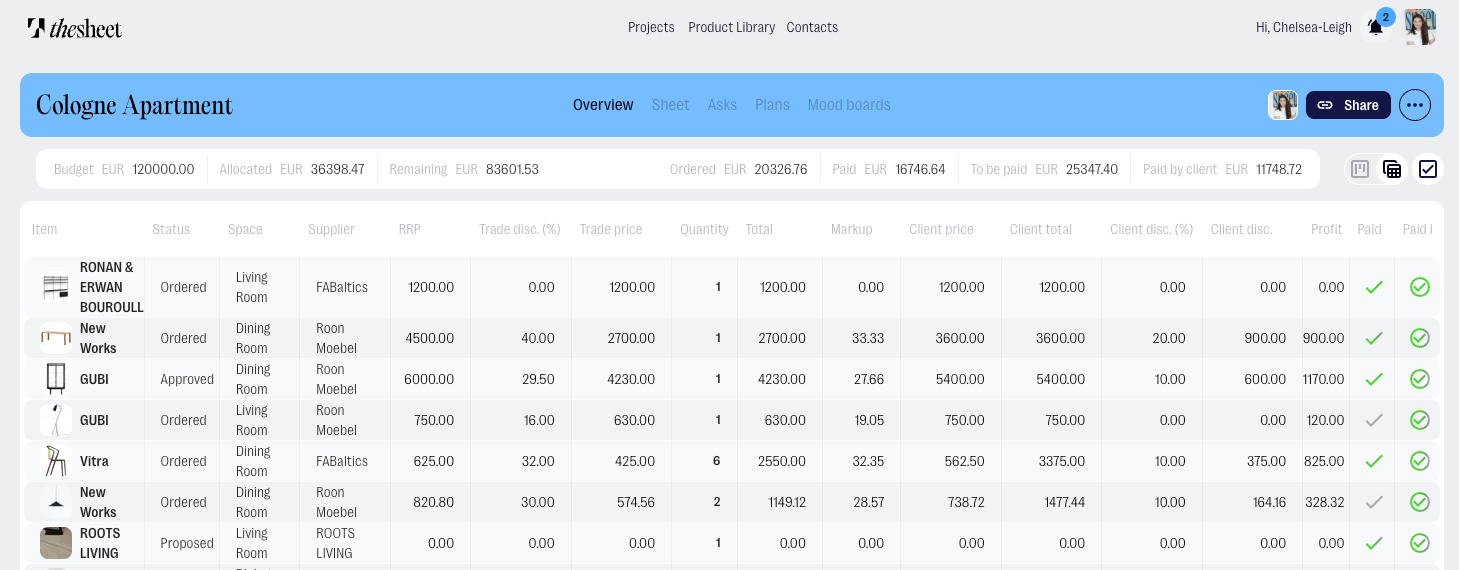
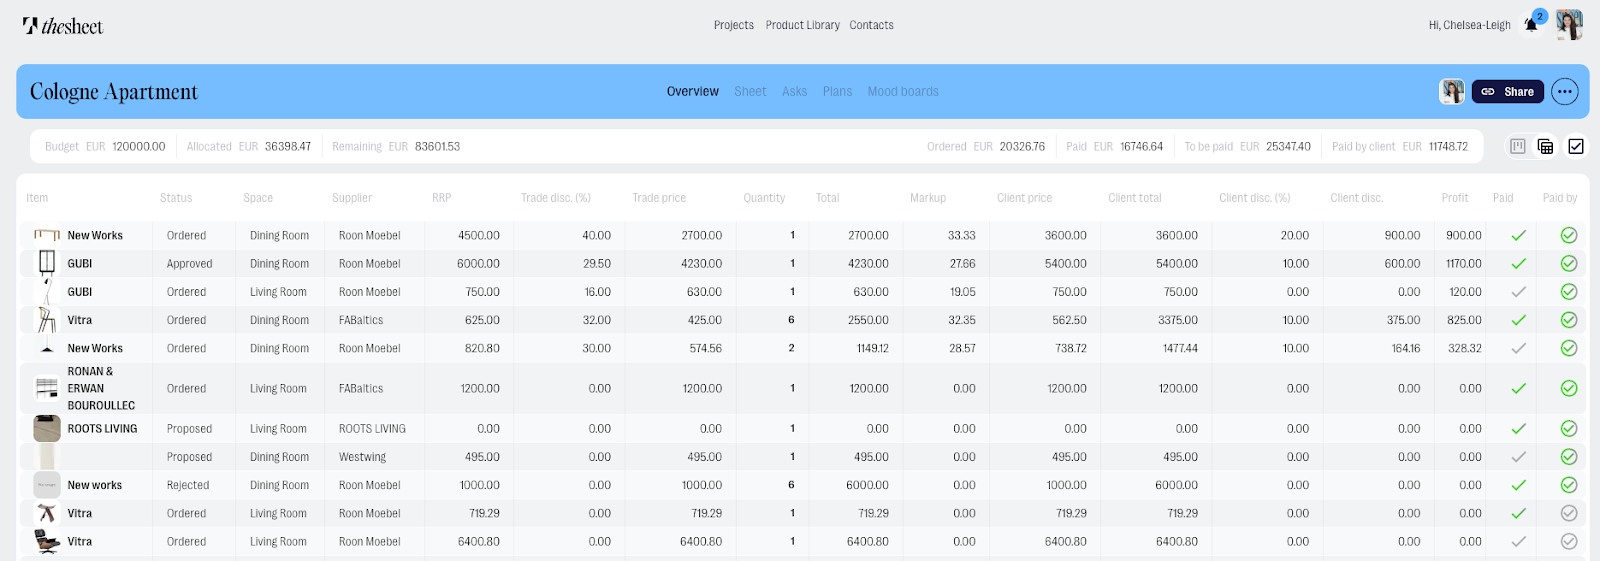
The margin table (or financial overview) gives you a comprehensive view of your entire project. It lists all the products with detailed pricing information, allowing you to:
- Track recommended retail prices (RRP) and trade discounts
- Calculate markup and profit margins
- Monitor client pricing and discounts
- Track payment status for both you and your client
1. Accessing the financial overview
- Open your project in thesheet
- Navigate to the Overview tab
- Click the Table View toggle button in the top right corner to switch from kanban view to margin table/financial view
- The margin tables will automatically pull the (RRP) Recommended Retail Price from the product details you’ve entered in your sheet view
- No need to manually re-enter data; the system links this information seamlessly
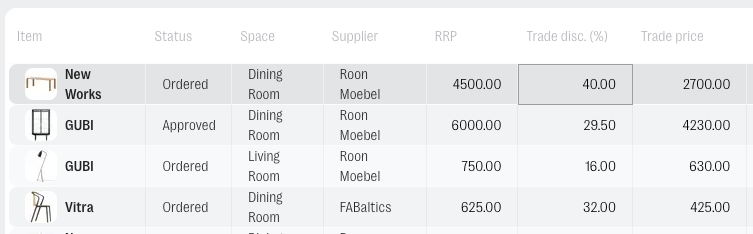
2. Input your supplier pricing
- In the margin table, you’ll find fields to input your negotiated price with the supplier.
- Choose to either:
- Enter the supplier’s trade price directly, or
- Add a trade discount percentage.
- thesheet will automatically calculate the correct trade price or discount value for you, minimising errors and manual maths.
Example: If a product's RRP is €1000, and your supplier offers you a 20% trade discount, simply input “20%” in the trade discount field, and thesheet will calculate that your trade price is €800.
3. Customise product markups:
- You can customise how much markup you apply to each product depending on your pricing strategy.
- For example, if your studio offers clients the full trade discount, you might apply a smaller markup to maintain profitability.
- Alternatively, you could stick with the RRP or adjust the markup for individual products or suppliers based on negotiation.
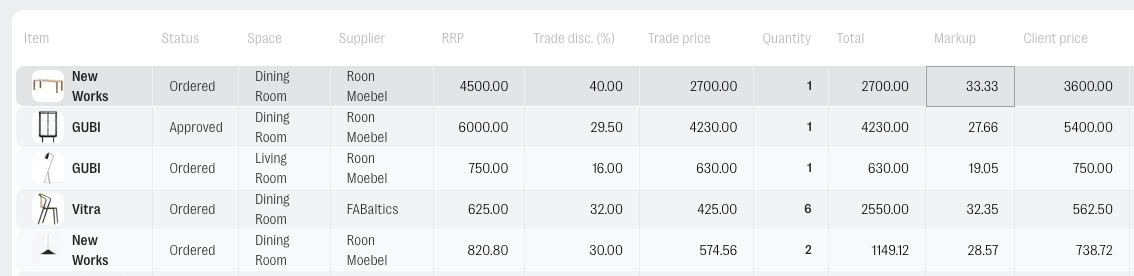
4. Track product profits:
- As you input trade pricing and markups, thesheet will show you the profit for each product.
- You can adjust these values dynamically to see how changes in your pricing affect your profit margins.
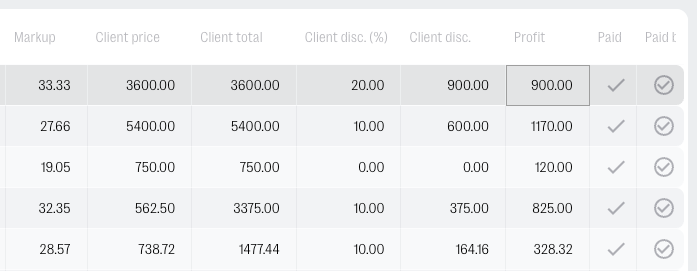
5. Client discount breakdown:
- thesheet provides an easy way to calculate the total and average discounts you’re passing on to your client. This allows you to clearly communicate the value you’re offering them through your trade discounts.
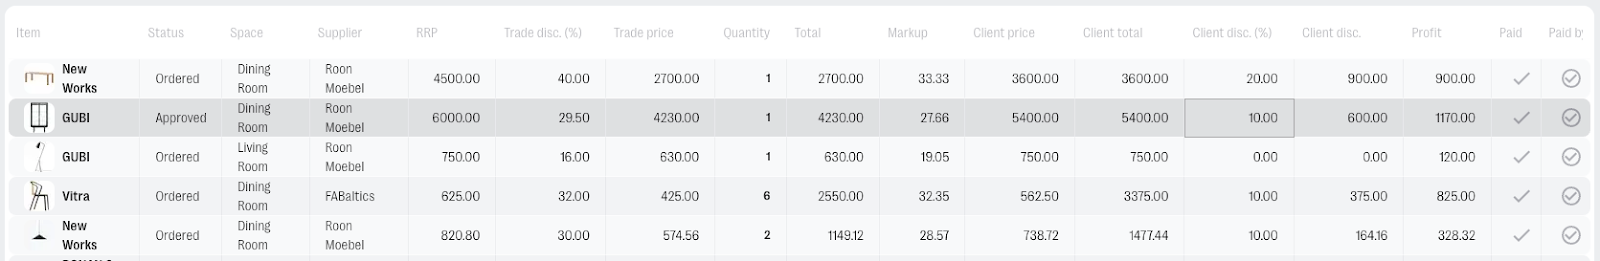
Understanding the margin table columns
The margin table displays comprehensive financial information in the following columns:
- RRP - Recommended Retail Price
- Trade discount % - Your discount percentage from suppliers
- Trade price - The price after trade discount is applied
- Quantity - Number of units
- Total - Total trade price (Trade price × Quantity)
- Markup - Your added margin percentage
- Client price - The price charged to your client per unit
- Client total - Total client price (Client price × Quantity)
- Client discount % - Any discount percentage offered to your client
- Client discount - The monetary value of the client discount
- Profit - Your profit on each product
Tracking payments
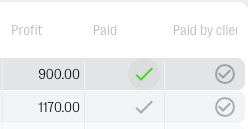
The margin table includes payment tracking columns that help you monitor what has been paid:
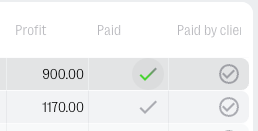
- Paid - Indicates if you have paid the supplier
- Click the grey payment icon once to change it to green, indicating that 100% of the payment has been made.
- For partial payment of 50% click the icon one more time (twice total. The icon will appear half-green to indicate a partial payment.
- Click the grey payment icon once to change it to green, indicating that 100% of the payment has been made.
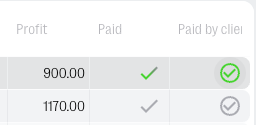
- Client paid - Indicates if your client has paid you
- Click the grey payment icon once to change it to green, indicating that 100% of the payment has been made.
- For partial payment of 50% click the icon one more time (twice total. The icon will appear half-green to indicate a partial payment.
- Click the grey payment icon once to change it to green, indicating that 100% of the payment has been made.

How the margin table connects to your project summary
The financial data in your margin table directly connects to the project summary bar, which shows:

- Budget - The total project budget set when creating the project
- Allocated - Total cost of all main products past draft status
- Remaining - Budget minus allocated amount
- Ordered - Cost of everything past approved status
- Paid - Sum of all items marked as paid
- To be paid - Ordered minus paid
- Paid by client - Sum of all items marked as client paid
Exporting financial summaries
You can export selected items from the margin table to create financial summaries or simple invoice annexes:
- Click the checkmark icon in the top right to enable multi-select
- Select the products you want to include in your export
- From the actions dropdown, select Export selection to PDF
- A preview will open in a new tab with your selected products
- The PDF will include: Product image, item name, RRP (Retail), client discount percentage, client price, quantity, and client total
- Click the print button on the bottom right to print all the previews to pdf.


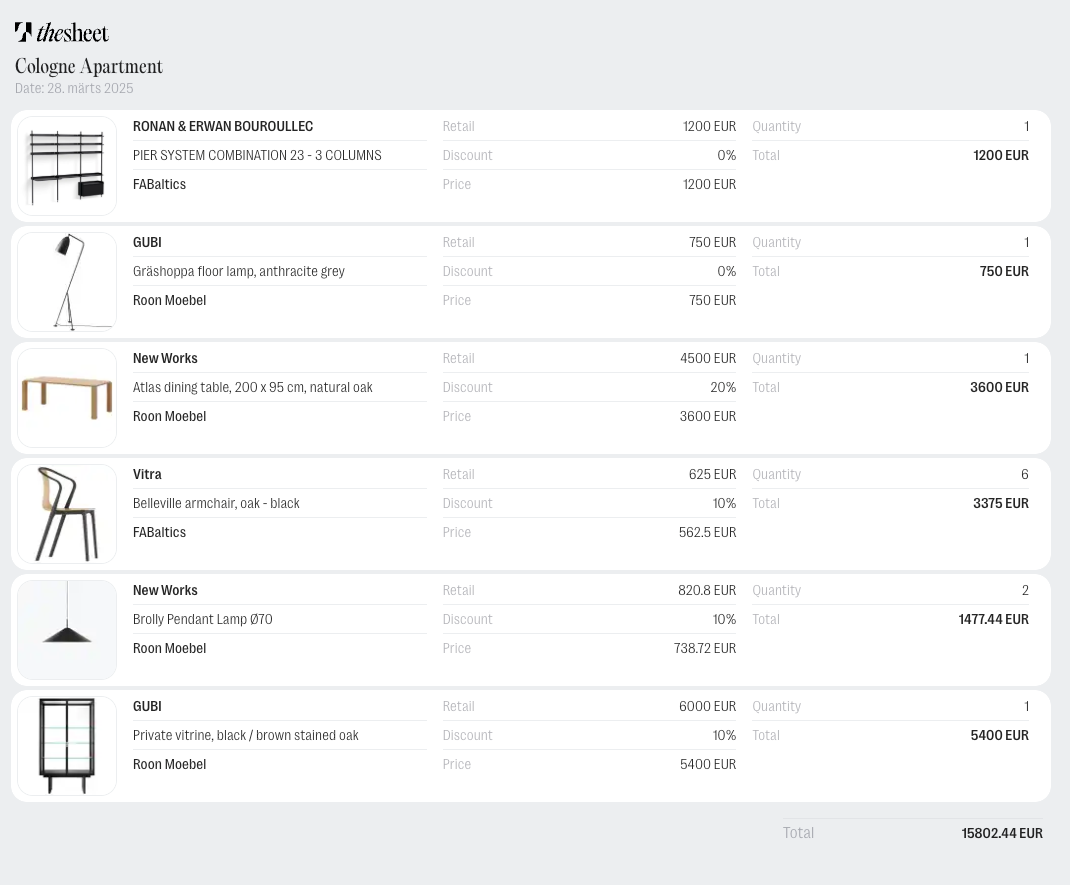
The exported PDF serves as a simplified cost annex to attach to your invoice or financial summary you can share with clients or for your own records.
Tips for using the margin table effectively
- Red profit warnings - Pay attention to red text in the profit column, which indicates negative profit margins
- Consistent currency formatting - All monetary values use a consistent format (e.g., 1234.56)
- Price synchronisation - Changes made in the margin table will automatically update in sheet view, and vice versa
- Regular verification - Regularly review your margin table to ensure all products have appropriate margins